

In order to perform processing on binary images, we must have them. We will learn to convert images into binary. The binarization is to transform a multi-bit pixel (2, 4, 8 or more) in a 1bit image. For that, we creat a threshold. If the pixel value is below the threshold, we associate the value 0. If the pixel value is equal to or supperior to the threshold we give the value of 1. If the image is grayscale there is no problem because there is only one color component. A pixel is encoded with a number. For color images is different. In fact we have three color components (red blue and green for example). The first step is to convert a color image into grayscale and then into binary image. The average of the components of a pixel is equivalent to convert it into grayscale.
if (length(size(x))>2)

        x=mean(x,3);% on prend une seul plan image noir et blanc chaque plan sont egaux

    end
By placing the line in the middle of the scale of values (k = 8 -> threshold = 2 k / 2) we obtain the following result:
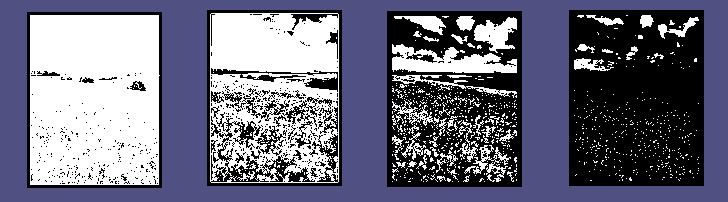
Thanks to the slider, we can manage the threshold and then see different results. Example with threshold = 5, 82, 156, 235
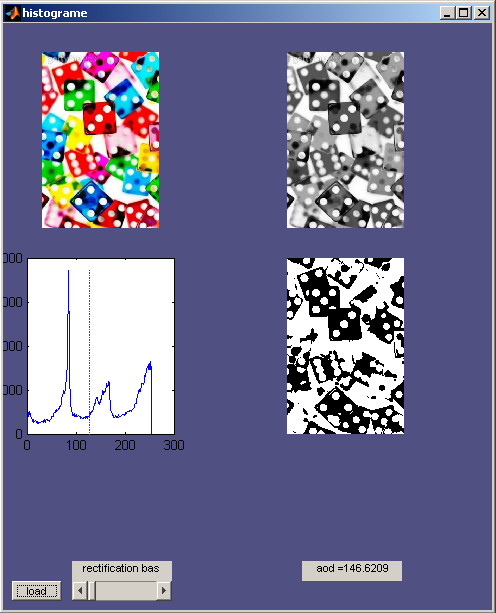
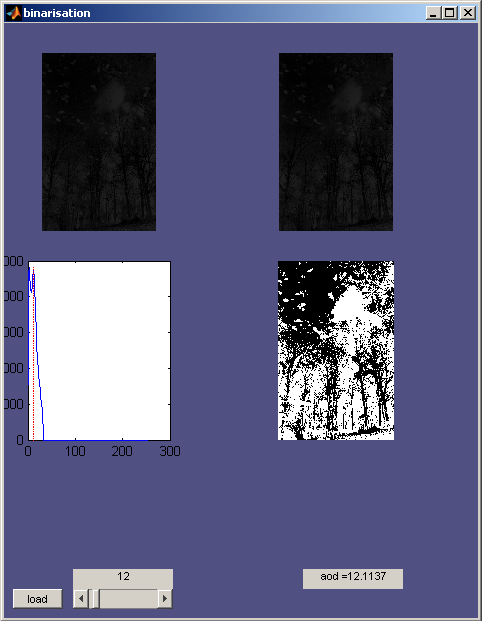
But, how to choose a good threshold to avoid an image too much or too little white (or black). A simple method is to take
a threshold that separates the histogram into two equal parts. Therefore, we take the AOD (Average Optical Density). In this
way, the binary image will contain many black pixel as white pixel. example with an image:
function guibinarisation


%translationfunction guihistogramme

clear all;

close all;

figure(  'name','binarisation',...

            'NumberTitle','off',...

            'MenuBar','none',...

            'color',[0.3137 0.3137 0.5098]);


a(1)=axes('units','normalized',...

    'position',[0.05 0.65 0.3 0.3]);

a(2)=axes('units','normalized',...

    'position',[0.05 0.3 0.3 0.3]);

a(3)=axes('units','normalized',...

    'position',[0.55 0.65 0.3 0.3]);

a(4)=axes('units','normalized',...

    'position',[0.55 0.3 0.3 0.3]);


uicontrol(  'style','pushbutton',...

            'string','load',...

            'Position', [10 10 50 20],...

            'callback',@loadimage);


uicontrol(  'style','slider',...

            'string','seuil',...

            'Min' ,0,'Max',255, ...

            'Position', [70 10 100 20],...

            'Value', 0,...

            'SliderStep',[1/255 10/255], ...

            'callback',{@histogramme,'seuil'});

text(1)=uicontrol(  'style','text',...

            'string','rectification bas ',...

            'Position', [70 30 100 20]);

text(3)=uicontrol(  'style','text',...

            'string','aod =',...

            'Position', [300 30 100 20]);

%parametre initial

setappdata(gcf,'k',8);

setappdata(gcf,'x',1);

setappdata(gcf,'seuil',0);

setappdata(gcf,'hist',0);


function loadimage(~,~)

    % appeler quand appui check box

    [filename, pathname] = uigetfile({'*.jpg;*.tif;*.PNG;*.gif;*.bmp','All Image Files';...

          '*.*','All Files' },'mytitle',...

          'C:\Work\myfile.jpg')


    x = imread(filename);

    axes(a(1))

    imshow(x)

    if (length(size(x))>2)

        x=mean(x,3);% on prend une seul plan image noir et blanc chaque plan sont egaux

    end

    x=uint8(x);

    k = whos('x');

    if k.class == 'uint8'

        k=8;

    end

    setappdata(1,'k',k);

    setappdata(1,'x',x);

    axes(a(3))

    imshow(x)


    [ligne colonne]=size(x);

    hist = zeros(2^k,1);

     for i=1:ligne

        for j=1:colonne

           hist(x(i,j)+1) = hist(x(i,j)+1)+1;

        end

     end

    setappdata(1,'hist',hist);

    seuil = round(2^k/2);

    axes(a(2))

    plot([0:(2^k)-1],hist)

    hold on

    plot(seuil,[0:max(hist)/100:max(hist)],'r')

    hold off

    aod=sum(hist.*[0:(2^k)-1]')/(ligne*colonne);

    set( text(3), 'String', strcat('aod =',num2str(aod)));


    seuil = round(2^k/2);

    for i=1:ligne

        for j=1:colonne

            if x(i,j)<seuil

              img(i,j) = 0;

            else

              img(i,j) = 1;

            end

        end

    end

    axes(a(4))

    imshow(img)

end

function histogramme(hObj,~,name)

     val = round(get(hObj,'Value'));

     setappdata(1,name,val);

     seuil = getappdata(1,'seuil');

     img = getappdata(1,'x');

     k = getappdata(1,'k');

     hist = getappdata(1,'hist');

     axes(a(2))

     plot([0:(2^k)-1],hist)

     hold on

     plot(seuil,[0:max(hist)/100:max(hist)],'r')

     hold off

     [ligne colonne]=size(img);


     for i=1:ligne

        for j=1:colonne

            if img(i,j)<seuil

              img2(i,j) = 0;

            else

              img2(i,j) = 1;

            end

        end

     end

     %img=bool(img);

     axes(a(4))

     imshow(img2)


     aod=sum(hist.*[0:(2^k)-1]')/(ligne*colonne)

     set( text(1), 'String', seuil );

     set( text(3), 'String', strcat('aod =',num2str(aod)));


end

end
Copyright © 2010-2014, all rights reserved, contact: operationpixel@free.fr