


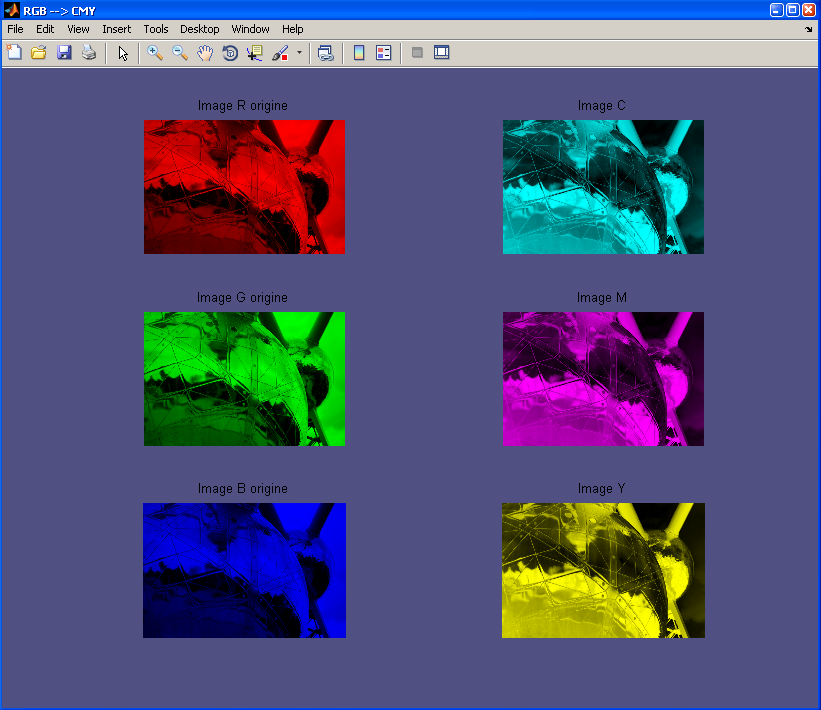
The color used in print is substractive. It uses the threeprimarycolors cyan (C), magenta (M) et yellow (Y). The sheet on wich we print are white so if C = M = Y = 0 no ink is used, so we have white. On the other hand, if C = M = Y = 1 The three inks are used and satured so the final color will be black. A simple way to compute the three components is:
Matlab program:
C=(255-R);

M=(255-G);

Y=(255-B);


figure(  'Name','RGB --> CMY',...

            'NumberTitle','off',...

            'color',[0.3137 0.3137 0.5098]);

vide=zeros(ligne,colonne);

subplot(321)

imshow(uint8(cat(3,R,vide,vide)))

title('Image R origine')

subplot(323)

imshow(uint8(cat(3,vide,G,vide)))

title('Image G origine')

subplot(325)

imshow(uint8(cat(3,vide,vide,B)))

title('Image B origine')

 subplot(322)

imshow(uint8(cat(3,vide,C,C)))

title('Image C')

subplot(324)

imshow(uint8(cat(3,M,vide,M)))

title('Image M')

subplot(326)

imshow(uint8(cat(3,Y,Y,vide)))

title('Image Y')
and an example
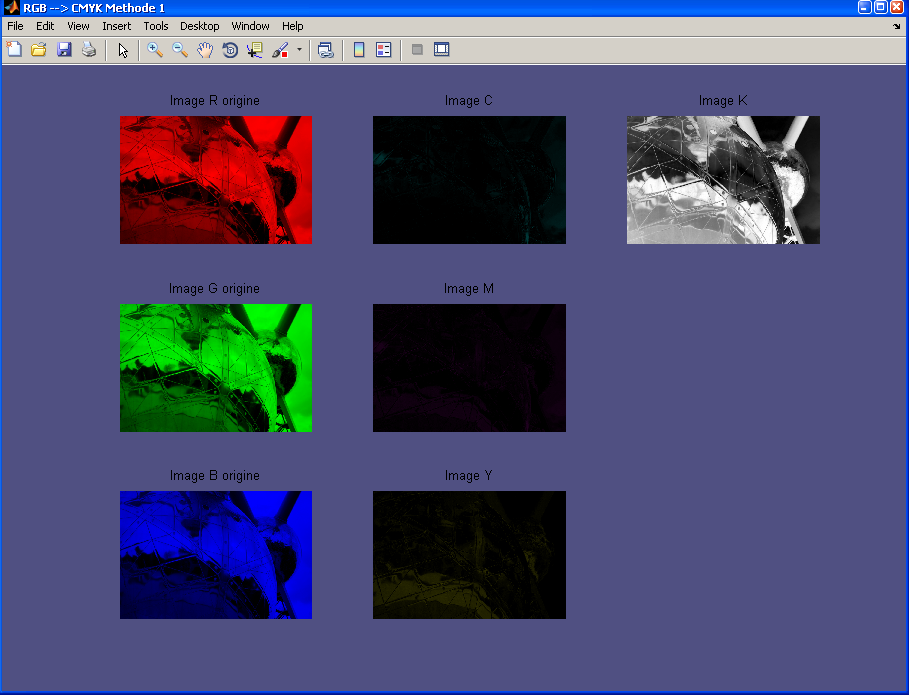
The saturation of the three components CMY doesn't make black for real, to correct it we generaly use black ink in addition. A simple technic is to compute the black component in that way:
We compute the new components CMY thanks to K.
we can use the next program:
% conversion RGB --> CMYK

% methode 1

C=(255-R);

M=(255-G);

Y=(255-B);

K=min(cat(3,C,M,Y),[],3);

C=C-K;

M=M-K;

Y=Y-K;


figure(  'Name','RGB --> CMYK Methode 1',...

            'NumberTitle','off',...

            'color',[0.3137 0.3137 0.5098]);

vide=zeros(ligne,colonne);

subplot(331)

imshow(uint8(cat(3,R,vide,vide)))

title('Image R origine')

subplot(334)

imshow(uint8(cat(3,vide,G,vide)))

title('Image G origine')

subplot(337)

imshow(uint8(cat(3,vide,vide,B)))

title('Image B origine')

 subplot(332)

imshow(uint8(cat(3,vide,C,C)))

title('Image C')

subplot(335)

imshow(uint8(cat(3,M,vide,M)))

title('Image M')

subplot(338)

imshow(uint8(cat(3,Y,Y,vide)))

title('Image Y')

subplot(333)

imshow(uint8(cat(3,K,K,K)))

title('Image K')
An example
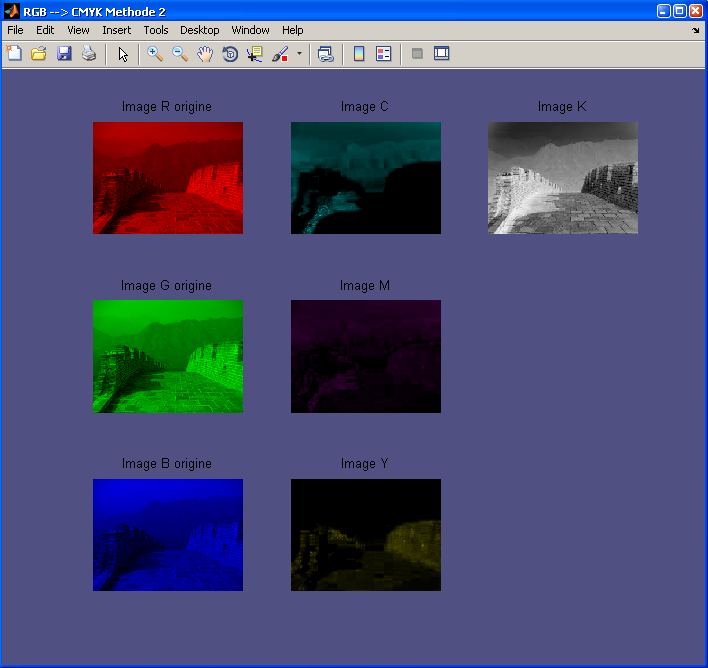
An other method is to reduce the components CMY by a factor f where: if and 1 if . So we have
In this way if R = G = B then the print just use black ink.
here, the program:
% conversion RGB --> CMYK

% methode 2

% normalisation

Rn=R/255;

Gn=G/255;

Bn=B/255;

Cn=(1-Rn);

Mn=(1-Gn);

Yn=(1-Bn);

Kn=min(cat(3,Cn,Mn,Yn),[],3);

Knp=Kn;

Kn=1./(1-Kn);

Kn(Kn==Inf)= 1;

Cn=(Cn-Knp).*Kn;

Mn=(Mn-Knp).*Kn;

Yn=(Yn-Knp).*Kn;

% dénormalisation

C=Cn*255;

M=Mn*255;

Y=Yn*255;

K=Knp*255;

figure(  'Name','RGB --> CMYK Methode 2',...

            'NumberTitle','off',...

            'color',[0.3137 0.3137 0.5098]);

vide=zeros(ligne,colonne);

subplot(331)

imshow(uint8(cat(3,R,vide,vide)))

title('Image R origine')

subplot(334)

imshow(uint8(cat(3,vide,G,vide)))

title('Image G origine')

subplot(337)

imshow(uint8(cat(3,vide,vide,B)))

title('Image B origine')

 subplot(332)

imshow(uint8(cat(3,vide,C,C)))

title('Image C')

subplot(335)

imshow(uint8(cat(3,M,vide,M)))

title('Image M')

subplot(338)

imshow(uint8(cat(3,Y,Y,vide)))

title('Image Y')

subplot(333)

imshow(uint8(cat(3,K,K,K)))

title('Image K')
And an example
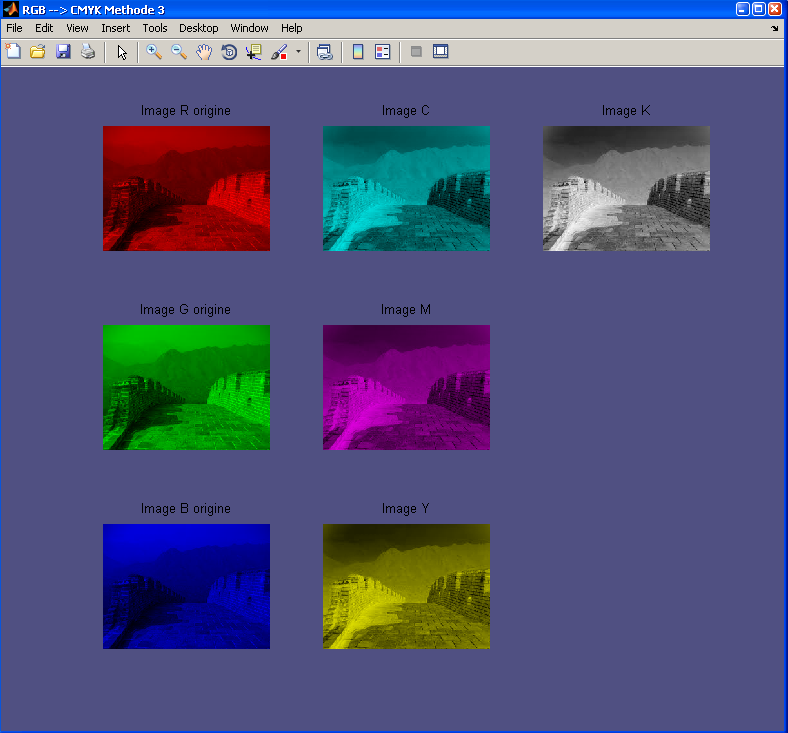
With
The program
% conversion RGB --> CMYK

% methode 3

% normalisation

Rn=R/255;

Gn=G/255;

Bn=B/255;

Cn=(1-Rn);

Mn=(1-Gn);

Yn=(1-Bn);

Kn=min(cat(3,Cn,Mn,Yn),[],3);


Sk = 0.1;

FucrK = Sk * Kn;


Ko = 0.3;

FBGK=(Kn<Ko)* (max(max(Kn))) .* (Kn-Ko)./(1-Ko);


Cn=(Cn-FucrK);

Mn=(Mn-FucrK);

Yn=(Yn-FucrK);

Kn=FBGK;

% dénormalisation

C=Cn*255;

M=Mn*255;

Y=Yn*255;

K=Knp*255;

figure(  'Name','RGB --> CMYK Methode 3',...

            'NumberTitle','off',...

            'color',[0.3137 0.3137 0.5098]);

vide=zeros(ligne,colonne);

subplot(331)

imshow(uint8(cat(3,R,vide,vide)))

title('Image R origine')

subplot(334)

imshow(uint8(cat(3,vide,G,vide)))

title('Image G origine')

subplot(337)

imshow(uint8(cat(3,vide,vide,B)))

title('Image B origine')

 subplot(332)

imshow(uint8(cat(3,vide,C,C)))

title('Image C')

subplot(335)

imshow(uint8(cat(3,M,vide,M)))

title('Image M')

subplot(338)

imshow(uint8(cat(3,Y,Y,vide)))

title('Image Y')

subplot(333)

imshow(uint8(cat(3,K,K,K)))

title('Image K')
An example
clear all;

close all;


[filename, pathname] = uigetfile({'*.jpg;*.tif;*.png;*.gif;*.bmp','All Image Files';...

          '*.*','All Files' },'mytitle',...

          'C:\Work\myfile.jpg');


img = imread(filename);

[ligne colonne dimension]=size(img);

img=double(img);

R=img(:,:,1);

G=img(:,:,2);

B=img(:,:,3);

Imax = max(max(img));


% conversion RGB --> CMY

C=(255-R);

M=(255-G);

Y=(255-B);


figure(  'Name','RGB --> CMY',...

            'NumberTitle','off',...

            'color',[0.3137 0.3137 0.5098]);

vide=zeros(ligne,colonne);

subplot(321)

imshow(uint8(cat(3,R,vide,vide)))

title('Image R origine')

subplot(323)

imshow(uint8(cat(3,vide,G,vide)))

title('Image G origine')

subplot(325)

imshow(uint8(cat(3,vide,vide,B)))

title('Image B origine')

 subplot(322)

imshow(uint8(cat(3,vide,C,C)))

title('Image C')

subplot(324)

imshow(uint8(cat(3,M,vide,M)))

title('Image M')

subplot(326)

imshow(uint8(cat(3,Y,Y,vide)))

title('Image Y')


% conversion RGB --> CMYK

% methode 1

C=(255-R);

M=(255-G);

Y=(255-B);

K=min(cat(3,C,M,Y),[],3);

C=C-K;

M=M-K;

Y=Y-K;


figure(  'Name','RGB --> CMYK Methode 1',...

            'NumberTitle','off',...

            'color',[0.3137 0.3137 0.5098]);

vide=zeros(ligne,colonne);

subplot(331)

imshow(uint8(cat(3,R,vide,vide)))

title('Image R origine')

subplot(334)

imshow(uint8(cat(3,vide,G,vide)))

title('Image G origine')

subplot(337)

imshow(uint8(cat(3,vide,vide,B)))

title('Image B origine')

 subplot(332)

imshow(uint8(cat(3,vide,C,C)))

title('Image C')

subplot(335)

imshow(uint8(cat(3,M,vide,M)))

title('Image M')

subplot(338)

imshow(uint8(cat(3,Y,Y,vide)))

title('Image Y')

subplot(333)

imshow(uint8(cat(3,K,K,K)))

title('Image K')


% conversion RGB --> CMYK

% methode 2

% normalisation

Rn=R/255;

Gn=G/255;

Bn=B/255;

Cn=(1-Rn);

Mn=(1-Gn);

Yn=(1-Bn);

Kn=min(cat(3,Cn,Mn,Yn),[],3);

Knp=Kn;

Kn=1./(1-Kn);

Kn(Kn==Inf)= 1;

Cn=(Cn-Knp).*Kn;

Mn=(Mn-Knp).*Kn;

Yn=(Yn-Knp).*Kn;

% dénormalisation

C=Cn*255;

M=Mn*255;

Y=Yn*255;

K=Knp*255;

figure(  'Name','RGB --> CMYK Methode 2',...

            'NumberTitle','off',...

            'color',[0.3137 0.3137 0.5098]);

vide=zeros(ligne,colonne);

subplot(331)

imshow(uint8(cat(3,R,vide,vide)))

title('Image R origine')

subplot(334)

imshow(uint8(cat(3,vide,G,vide)))

title('Image G origine')

subplot(337)

imshow(uint8(cat(3,vide,vide,B)))

title('Image B origine')

 subplot(332)

imshow(uint8(cat(3,vide,C,C)))

title('Image C')

subplot(335)

imshow(uint8(cat(3,M,vide,M)))

title('Image M')

subplot(338)

imshow(uint8(cat(3,Y,Y,vide)))

title('Image Y')

subplot(333)

imshow(uint8(cat(3,K,K,K)))

title('Image K')


% conversion RGB --> CMYK

% methode 3

% normalisation

Rn=R/255;

Gn=G/255;

Bn=B/255;

Cn=(1-Rn);

Mn=(1-Gn);

Yn=(1-Bn);

Kn=min(cat(3,Cn,Mn,Yn),[],3);


Sk = 0.1;

FucrK = Sk * Kn;


Ko = 0.3;

FBGK=(Kn<Ko)* (max(max(Kn))) .* (Kn-Ko)./(1-Ko);


Cn=(Cn-FucrK);

Mn=(Mn-FucrK);

Yn=(Yn-FucrK);

Kn=FBGK;

% dénormalisation

C=Cn*255;

M=Mn*255;

Y=Yn*255;

K=Knp*255;

figure(  'Name','RGB --> CMYK Methode 3',...

            'NumberTitle','off',...

            'color',[0.3137 0.3137 0.5098]);

vide=zeros(ligne,colonne);

subplot(331)

imshow(uint8(cat(3,R,vide,vide)))

title('Image R origine')

subplot(334)

imshow(uint8(cat(3,vide,G,vide)))

title('Image G origine')

subplot(337)

imshow(uint8(cat(3,vide,vide,B)))

title('Image B origine')

 subplot(332)

imshow(uint8(cat(3,vide,C,C)))

title('Image C')

subplot(335)

imshow(uint8(cat(3,M,vide,M)))

title('Image M')

subplot(338)

imshow(uint8(cat(3,Y,Y,vide)))

title('Image Y')

subplot(333)

imshow(uint8(cat(3,K,K,K)))

title('Image K')
Copyright © 2010-2014, all rights reserved, contact: operationpixel@free.fr