

Here, we propose a detection of objects in an image. We detect white objects on a black background of a binary image.
The opposite is possible, simply reverse the bit values for the conditions (0 -> 1 and 1 -> 0). To detect these objects,
we look at three pixel at a time. The current pixel, the pixel to the left and top pixel. We read the picture from left to
right and from top to bottom. If you do not read the image in that way, you must choose the neighbors of the current pixel
which corespond. Look at the following images, they give us all the possibilities.
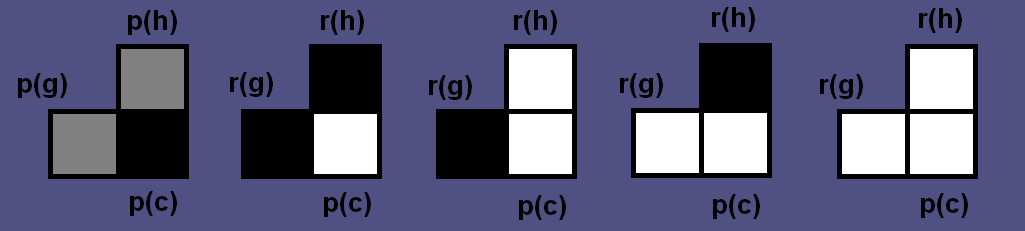
With p(c) the current pixel, p(g) the left pixel and p(h) of the pixel above. We initialize two variables, a matrix of the
same size as the image with 0 (region) and a scalar to 1 (regionnombre).
Now we have a matrix containing all the objects we have detected. Before, we saw that some regions are the same as others. We have saved them in correspondancetrouve. We must now make corresponding labels. To do that, we start with the bigest label. For each label, we searched the smallest correlation label that goes with the label which are treated. Once found, we replace the labels in the matrix r. This is a lengthy operation because we have to do as much times there are different labels.
clear all; close all;


[filename, pathname] = uigetfile({'*.jpg;*.tif;*.png;*.gif;*.bmp','All Image Files';...

          '*.*','All Files' },'mytitle',...

          'C:\Work\myfile.jpg')

x = imread(filename);

% image sur un plan

if (length(size(x))>2)

    x=mean(x,3);% passage de 3 dimensions à 1 ( couleur->niveau de gris)

end

% nombre de bit

k=8;

%taille de la matrice

[ligne colonne]=size(x);

% on inverse l'image les objets sont blanc

x=x/255;

for i = 1 : ligne

    for j = 1 : colonne

        x(i,j)=1-x(i,j);

    end

end

% on crée une matrice resultat de la même cast que l'image

r = ones(ligne,colonne);

regionnombre = 1;

correspondance = [0 0];

correspondancetrouve = 1;

%labellisation


% algorithme de l'inversion

for i=2:ligne

     for j=2:colonne

         if (x(i,j)==0)

             r(i,j)=0;

         elseif (x(i,j)==1)

             if (r(i-1,j)==0 && r(i,j-1)==0)

                 r(i,j)=regionnombre;

                 regionnombre = regionnombre +1;

             elseif (r(i-1,j)~=0 && r(i,j-1)==0)

                 r(i,j)=r(i-1,j);

             elseif (r(i-1,j)==0 && r(i,j-1)~=0)

                 r(i,j)=r(i,j-1);

             elseif (r(i-1,j)~=0 && r(i,j-1)~=0 && r(i-1,j)==r(i,j-1))

                 r(i,j)=r(i,j-1);

             elseif (r(i-1,j)~=0 && r(i,j-1)~=0 && r(i-1,j)~=r(i,j-1))

                 if r(i-1,j) < r(i,j-1)

                     r(i,j)=r(i-1,j);

                 else

                     r(i,j)=r(i,j-1);

                 end

                 correspondance(correspondancetrouve,:)= [r(i-1,j) r(i,j-1)];

                 correspondancetrouve = correspondancetrouve + 1;

             end

         end


     end

end

% mise a jour du resutlat selon les correspondances

for nb = regionnombre-1 : -1 : 1

    a=nb;

    for c = 1 : length(correspondance)

        if correspondance(c,1)==nb

            if correspondance(c,2)<a

                a=correspondance(c,2);

            end

        end

    end

    for c = 1 : length(correspondance)

        if correspondance(c,2)==nb

            if correspondance(c,1)<a

                a=correspondance(c,1);

            end

        end

    end


    for i=2:ligne

         for j=2:colonne

             if  r(i,j) == nb

                 r(i,j)= a;

             end

         end

    end

end

% les couleurs des objets sont réparties en niveau de gris de 50 à 205.

for i = 1: ligne

    for j = 1 : colonne

        if r(i,j)==0

        else

            r(i,j)=r(i,j)*200/max(max(r))+50;

        end

    end

end

r=uint8(r);%conversion en uint8 pour l'affichage.

 % on affiche le resultat

 figure(  'name','etiquetage',...

            'NumberTitle','off',...

            'color',[0.3137 0.3137 0.5098]);

 subplot(121)

 imshow(x*255)

 subplot(122)

 imshow(r)

A problem can appear, small objects are detected when there are just noise in images. One method is to delete is to perform
an 'erosion', 'closed' or 'majority' of the binary image before labeling.

This correction is to count the number of pixels contained in an object, if this number is below a certain threshold (for us will be 10 pixels) then it is considered a minor area, and removed.
clear all; close all;


[filename, pathname] = uigetfile({'*.jpg;*.tif;*.png;*.gif;*.bmp','All Image Files';...

          '*.*','All Files' },'mytitle',...

          'C:\Work\myfile.jpg')

x = imread(filename);

% image sur un plan

if (length(size(x))>2)

    x=mean(x,3);% passage de 3 dimensions à 1 ( couleur->niveau de gris)

end

% nombre de bit

k=8;

%taille de la matrice

[ligne colonne]=size(x);

% on inverse l'image les objets sont blanc

x=x/255;

for i = 1 : ligne

    for j = 1 : colonne

        x(i,j)=1-x(i,j);

    end

end

% on crée une matrice resultat de la même cast que l'image

r = ones(ligne,colonne);

regionnombre = 1;

correspondance = [0 0];

correspondancetrouve = 1;

%labellisation


% algorithme de l'inversion

for i=2:ligne

     for j=2:colonne

         if (x(i,j)==0)

             r(i,j)=0;

         elseif (x(i,j)==1)

             if (r(i-1,j)==0 && r(i,j-1)==0)

                 r(i,j)=regionnombre;

                 regionnombre = regionnombre +1;

             elseif (r(i-1,j)~=0 && r(i,j-1)==0)

                 r(i,j)=r(i-1,j);

             elseif (r(i-1,j)==0 && r(i,j-1)~=0)

                 r(i,j)=r(i,j-1);

             elseif (r(i-1,j)~=0 && r(i,j-1)~=0 && r(i-1,j)==r(i,j-1))

                 r(i,j)=r(i,j-1);

             elseif (r(i-1,j)~=0 && r(i,j-1)~=0 && r(i-1,j)~=r(i,j-1))

                 if r(i-1,j) < r(i,j-1)

                     r(i,j)=r(i-1,j);

                 else

                     r(i,j)=r(i,j-1);

                 end

                 correspondance(correspondancetrouve,:)= [r(i-1,j) r(i,j-1)];

                 correspondancetrouve = correspondancetrouve + 1;

             end

         end


     end

end

% mise a jour du resutlat selon les correspondances

for nb = regionnombre-1 : -1 : 1

    a=nb;

    for c = 1 : length(correspondance)

        if correspondance(c,1)==nb

            if correspondance(c,2)<a

                a=correspondance(c,2);

            end

        end

    end

    for c = 1 : length(correspondance)

        if correspondance(c,2)==nb

            if correspondance(c,1)<a

                a=correspondance(c,1);

            end

        end

    end


    for i=2:ligne

         for j=2:colonne

             if  r(i,j) == nb

                 r(i,j)= a;

             end

         end

    end

end


% suppression des régions mineurs

rmineur=r;

regionmineur = [];

for nb = 1 : max(max(r))

    count = 0;

    for i = 1: ligne

        for j = 1 : colonne

            if rmineur(i,j)==nb

                count = count+1;

             end

        end

    end

    regionmineur(nb,:)=[nb count];

end

for nb = 1 : length(regionmineur)

    if regionmineur(nb,2)<10

        for i = 1: ligne

            for j = 1 : colonne

                 if rmineur(i,j)== regionmineur(nb,1)

                     rmineur(i,j)=0;

                 end

            end

        end

    end

end

% les couleurs des objets sont réparties en niveau de gris de 50 à 205.

for i = 1: ligne

    for j = 1 : colonne

        if r(i,j)==0

        else

            r(i,j)=r(i,j)*200/max(max(r))+50;

        end

    end

end

for i = 1: ligne

    for j = 1 : colonne

        if rmineur(i,j)==0

        else

            rmineur(i,j)=r(i,j)*200/max(max(rmineur))+50;

        end

    end

end

r=uint8(r);%conversion en uint8 pour l'affichage.

rmineur=uint8(rmineur);

 % on affiche le resultat

 figure(  'name','etiquetage',...

            'NumberTitle','off',...

            'color',[0.3137 0.3137 0.5098]);

 subplot(221)

 imshow(x*255)

 subplot(222)

 imshow(r)

  subplot(224)

 imshow(rmineur)


Copyright © 2010-2014, all rights reserved, contact: operationpixel@free.fr