

For next compute we use:
clear all;

close all;


[filename, pathname] = uigetfile({'*.jpg;*.tif;*.png;*.gif;*.bmp','All Image Files';...

          '*.*','All Files' },'mytitle',...

          'C:\Work\myfile.jpg');


img = imread(filename);

[ligne colonne dimension]=size(img);

img=double(img);

R=img(:,:,1);

G=img(:,:,2);

B=img(:,:,3);


% rgb to HSV

H=zeros(ligne,colonne);

S=zeros(ligne,colonne);

V=zeros(ligne,colonne);

for l = 1 : ligne

    for c =  1: colonne

        Imax = max(max([R(l,c) G(l,c) B(l,c)]));

        Imin = min(min([R(l,c) G(l,c) B(l,c)]));


        if Imax == Imin

            ;

        elseif Imax == R(l,c)

            H(l,c) = mod((60 * (G(l,c) - B(l,c)) / (Imax-Imin) + 360) , 360);

        elseif Imax == G(l,c)

            H(l,c) = 60 * (B(l,c) - R(l,c)) / (Imax-Imin) + 120;

        elseif Imax == B(l,c)

            H(l,c) = 60 * (R(l,c) - G(l,c)) / (Imax-Imin) + 240;

        end


        if Imax ~= 0

            S(l,c) = 1 - (Imin/Imax);

        end


        V(l,c)= Imax;


    end

end


Rp=zeros(ligne,colonne);

Gp=zeros(ligne,colonne);

Bp=zeros(ligne,colonne);

for i = 1 : ligne

    for j =  1: colonne

         v=V(i,j);

         h = mod(floor(H(i,j)/60),6);

         f = H(i,j)/60 - h;

         l = v*(1-S(i,j));

         m = v*(1-f*S(i,j));

         n = v*(1-(1-f)*S(i,j));

         if h == 0

             Rp(i,j)=v; Gp(i,j)= n; Bp(i,j)= l;

         elseif h == 1

             Rp(i,j)=m; Gp(i,j)= v; Bp(i,j)= l;

         elseif h == 2

             Rp(i,j)=l; Gp(i,j)= v; Bp(i,j)= n;

         elseif h == 3

             Rp(i,j)=l; Gp(i,j)= m; Bp(i,j)= v;

         elseif h == 4

             Rp(i,j)=n; Gp(i,j)= l; Bp(i,j)= v;

         elseif h == 5

             Rp(i,j)=v; Gp(i,j)= l; Bp(i,j)= m;

         end


    end

end


figure(  'Name','RGB --> HSV --> RGB',...

            'NumberTitle','off',...

            'color',[0.3137 0.3137 0.5098]);

vide=zeros(ligne,colonne);

subplot(4,3,1)

imshow(uint8(cat(3,R,G,B)))

title('Image origine')

subplot(4,3,4)

imshow(uint8(cat(3,R,vide,vide)))

title('Image R origine')

subplot(4,3,7)

imshow(uint8(cat(3,vide,G,vide)))

title('Image G origine')

subplot(4,3,10)

imshow(uint8(cat(3,vide,vide,B)))

title('Image B origine')


 subplot(4,3,5)

imagesc(H,[min(min(H)) max(max(H))])

colormap('gray')

axis image

title('Image H')

subplot(4,3,8)

imagesc(S,[min(min(S)) max(max(S))])

colormap('gray')

axis image

title('Image S')

subplot(4,3,11)

imagesc(V,[min(min(V)) max(max(V))])

colormap('gray')

axis image

title('Image V')


 subplot(4,3,3)

imshow(uint8(cat(3,Rp,Gp,Bp)))

title('Image reconstuite')

 subplot(4,3,6)

imshow(uint8(cat(3,Rp,vide,vide)))

title('Image R reconstuite')

subplot(4,3,9)

imshow(uint8(cat(3,vide,Gp,vide)))

title('Image G reconstuite')

subplot(4,3,12)

imshow(uint8(cat(3,vide,vide,Bp)))

title('Image B reconstuite')

clear all;
close all;
[filename, pathname] = uigetfile({'*.jpg;*.tif;*.png;*.gif;*.bmp','All Image Files';...
'*.*','All Files' },'mytitle',...
'C:\Work\myfile.jpg');
img = imread(filename);
[ligne colonne dimension]=size(img);
img=double(img);
R=img(:,:,1);
G=img(:,:,2);
B=img(:,:,3);
% rgb to HLS
R=R/255;
G=G/255;
B=B/255;
H=zeros(ligne,colonne);
L=zeros(ligne,colonne);
S=zeros(ligne,colonne);
for l = 1 : ligne
for c = 1: colonne
Imax = max(max([R(l,c) G(l,c) B(l,c)]));
Imin = min(min([R(l,c) G(l,c) B(l,c)]));
C = Imax - Imin;
if C == 0
H(l,c) = NaN;
elseif Imax == R(l,c)
H(l,c) = mod(((G(l,c) - B(l,c)) / (C)),6);
elseif Imax == G(l,c)
H(l,c) = (B(l,c) - R(l,c)) / (C) + 2;
elseif Imax == B(l,c)
H(l,c) = (R(l,c) - G(l,c)) / (C) + 4;
end
L(l,c)= 0.5*(Imax+Imin);
if C ~= 0
S(l,c) = C / (1-abs(2*L(l,c)-1));
end
end
end
H=H*60;
Rp=zeros(ligne,colonne);
Gp=zeros(ligne,colonne);
Bp=zeros(ligne,colonne);
Hp=H/60;
for i = 1 : ligne
for j = 1: colonne
C=(1-abs(2*L(i,j)-1))* S(i,j);
h=Hp(i,j);
X=C*(1-abs(mod(h,2)-1));
h=floor(Hp(i,j));
if isnan(h)
Rp(i,j)=0; Gp(i,j)= 0; Bp(i,j)= 0;
elseif h == 0
Rp(i,j)=C; Gp(i,j)= X; Bp(i,j)= 0;
elseif h == 1
Rp(i,j)=X; Gp(i,j)= C; Bp(i,j)= 0;
elseif h == 2
Rp(i,j)=0; Gp(i,j)= C; Bp(i,j)= X;
elseif h == 3
Rp(i,j)=0; Gp(i,j)= X; Bp(i,j)= C;
elseif h == 4
Rp(i,j)=X; Gp(i,j)= 0; Bp(i,j)= C;
elseif h == 5
Rp(i,j)=C; Gp(i,j)= 0; Bp(i,j)= X;
end
Imin = L(i,j)-0.5 * C;
Rp(i,j)= Rp(i,j)+Imin;
Gp(i,j)= Gp(i,j)+Imin;
Bp(i,j)= Bp(i,j)+Imin;
end
end
R=R*255;
G=G*255;
B=B*255;
Rp=Rp*255;
Gp=Gp*255;
Bp=Bp*255;
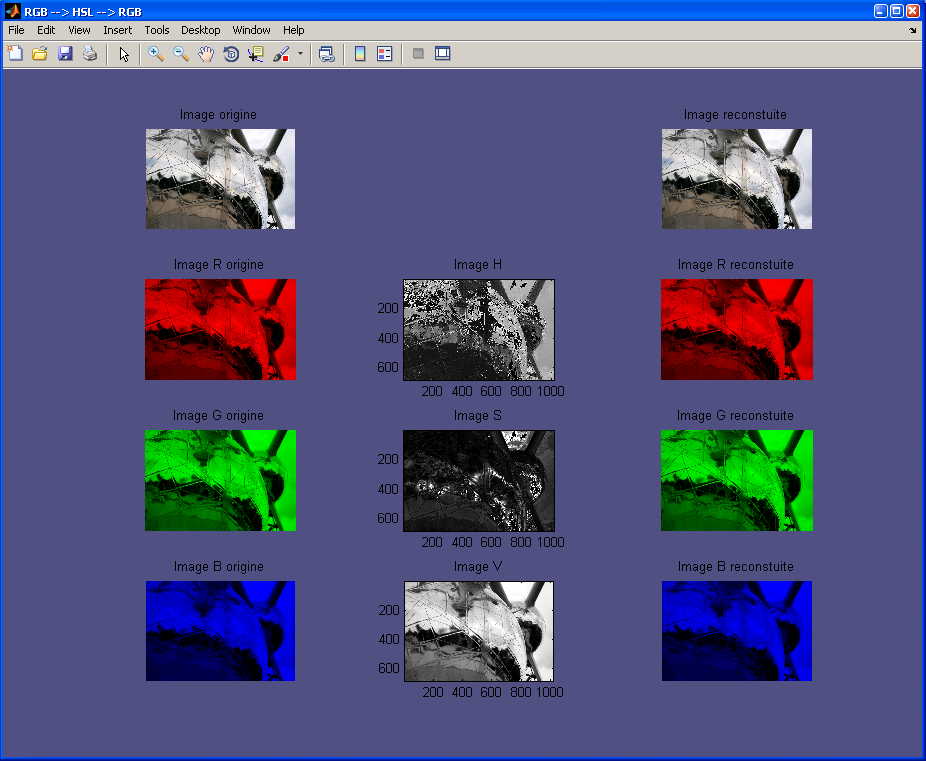
figure( 'Name','RGB --> HSL --> RGB',...
'NumberTitle','off',...
'color',[0.3137 0.3137 0.5098]);
vide=zeros(ligne,colonne);
subplot(4,3,1)
imshow(uint8(cat(3,R,G,B)))
title('Image origine')
subplot(4,3,4)
imshow(uint8(cat(3,R,vide,vide)))
title('Image R origine')
subplot(4,3,7)
imshow(uint8(cat(3,vide,G,vide)))
title('Image G origine')
subplot(4,3,10)
imshow(uint8(cat(3,vide,vide,B)))
title('Image B origine')
subplot(4,3,5)
imagesc(H,[min(min(H)) max(max(H))])
colormap('gray')
axis image
title('Image H')
subplot(4,3,8)
imagesc(S,[min(min(S)) max(max(S))])
colormap('gray')
axis image
title('Image S')
subplot(4,3,11)
imagesc(V,[min(min(V)) max(max(V))])
colormap('gray')
axis image
title('Image V')
subplot(4,3,3)
imshow(uint8(cat(3,Rp,Gp,Bp)))
title('Image reconstuite')
subplot(4,3,6)
imshow(uint8(cat(3,Rp,vide,vide)))
title('Image R reconstuite')
subplot(4,3,9)
imshow(uint8(cat(3,vide,Gp,vide)))
title('Image G reconstuite')
subplot(4,3,12)
imshow(uint8(cat(3,vide,vide,Bp)))
title('Image B reconstuite')